A beam can fade without all its missing energy becoming heat. Some light changes direction. Some transfers energy to matter.
Scattering redirects radiation; absorption transfers its energy to the particle. Together they produce extinction, the removal of light from the original beam. Light scattered out of one direction can appear in another, so loss of direct sunlight is not the same as loss of all sunlight at the ground.
These mechanisms depend on particle size, shape, refractive index and wavelength. Very small particles scatter differently from particles comparable to the wavelength of visible light. Mineral composition and carbonaceous material introduce absorption as well as scattering. A single label such as “dust” does not specify all those properties.
Mechanism diagram. Scattering redirects radiation; absorption transfers energy to the particle. Real scattering occurs over a continuous range of angles.
The extinction coefficient β describes attenuation per unit path. Integrating it vertically gives aerosol optical depth, τ. AOD at 550 nm refers to green light; AOD at another wavelength can differ. The quantity is dimensionless because distance in the integration cancels the inverse-distance unit of extinction.
For a direct beam, Beer–Lambert attenuation gives T = exp(−mτ), where m represents relative path length through the column. At τ = 0.20 and m = 1, about 82% of the direct beam survives the aerosol extinction in this idealisation. A lower Sun generally means a longer path.
Optical depth is not a percentage. An AOD of 0.20 does not mean exactly 20% of the direct beam is removed. The exponential relation is why doubling AOD does not simply halve transmission.
Go deeper: wavelength and the Ångström exponent
The empirical relation τ(λ) = τ₀(λ/λ₀)−α describes spectral dependence over a specified range. Larger α often accompanies a greater fine-particle influence, but size distribution, mixing and composition can produce ambiguity. The exponent is an optical descriptor, not a unique particle-size measurement.
Compare a weak spectral dependence with a strong one at the same optical depth at 550 nm. The green beam stays fixed while blue and red separate. Then increase path length: the same column removes a larger fraction of the direct beam.
The experiment isolates aerosol extinction. It does not calculate sky colour or the total solar energy reaching the surface, because those require molecular scattering, gases, clouds and light scattered into other directions.
TRY IT YOURSELF THE LIGHT LAB
Change the particles. Change the light.
How much direct light survives a column of aerosols? Adjust the optical properties and watch three wavelengths respond.
DIRECT BEAM TRANSMISSIONILLUSTRATIVE MODEL
0 · transparent2 · strong extinction
WeakStrong
Short pathLong path
Understand the model
τ(λ) = τ₅₅₀ (λ / 550 nm)−α T(λ) = exp[−m τ(λ)]
Beer–Lambert attenuation with an Ångström power law. This is aerosol-only direct-beam transmission, not a sky-colour simulation or a forecast. Molecular scattering, gases, clouds and multiple scattering are omitted. α describes spectral variation; it does not uniquely determine particle size or composition. Presets are illustrative parameters, not campaign observations.
Single-scattering albedo, written ω₀, is the fraction of extinction due to scattering: βsca/(βsca + βabs). A value near one means scattering dominates; lower values indicate a larger absorption share. The asymmetry parameter describes the average direction of scattering, with larger positive values indicating more forward scattering.
Neither property is supplied by AOD alone. A strongly scattering layer and a more absorbing layer can remove the same amount of direct light while redistributing energy differently. Surface brightness matters too: light reflected upward from a bright surface can encounter the aerosol again.
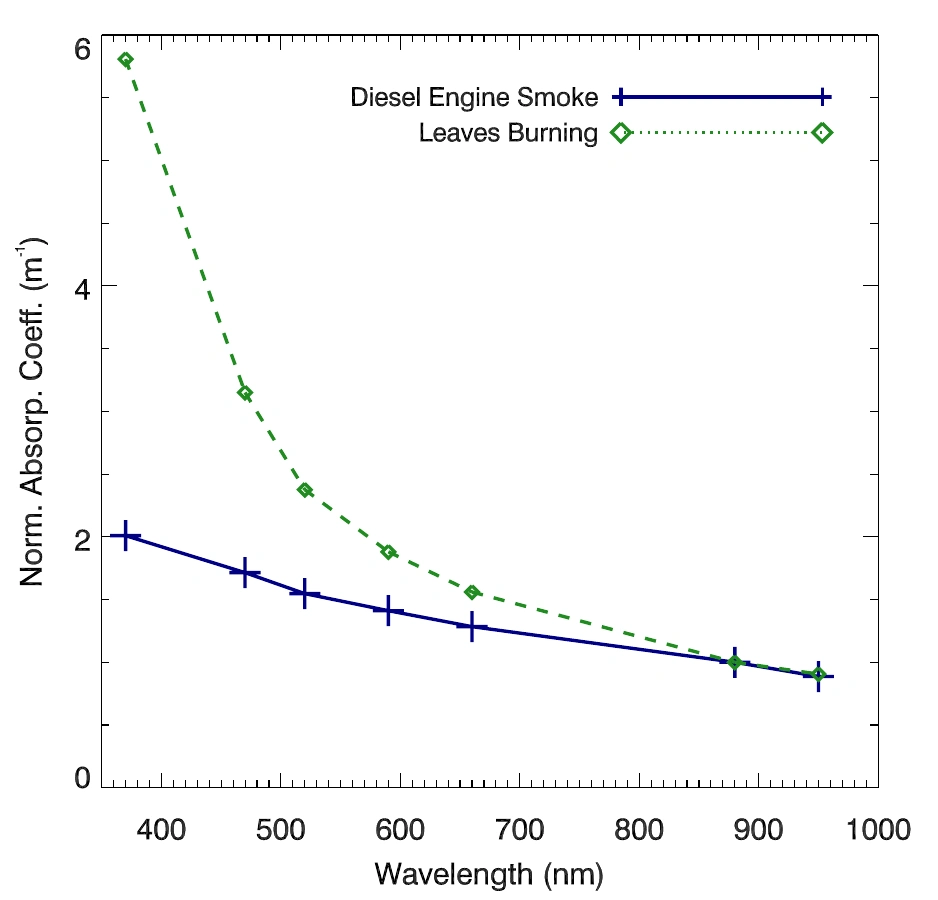
Gadhavi and Jayaraman’s Gadanki study combined seven-wavelength absorption measurements with five-wavelength AOD during April–November 2008. It showed why a modest contribution to optical depth can coexist with a much greater contribution to atmospheric absorption. Their inferred soot optical depth involved assumptions about boundary-layer depth and particle modes; the result is a case study, not a universal percentage. Read the study ↗
Gadhavi & Jayaraman (2010). Two observed source cases, normalised at 880 nm. The stronger short-wavelength dependence in the leaf-burning case motivates spectral source analysis; these two spectra do not uniquely identify all atmospheric mixtures. Original paper · CC BY 3.0. Open full resolution ↗
Both curves meet at the normalisation wavelength. Compare their shapes rather than reading the vertical scale as an unnormalised concentration. The source experiment illustrates why short-wavelength absorption supplies information beyond a single black-carbon channel.
To discuss a radiative effect, specify the boundary. A change in net downward energy at the surface differs from a change at the top of the atmosphere. Their difference describes the change in energy retained within the atmospheric column. Fluxes are measured in watts per square metre (W m⁻²).
A scattering aerosol can increase reflected sunlight. An absorbing aerosol can heat the atmosphere while reducing solar energy at the ground. The sign and magnitude of a calculated effect depend on aerosol properties, vertical position, clouds, surface reflectance and the definition of the comparison.
In the Hyderabad airborne-lidar study, Gadhavi and Jayaraman held several column optical properties fixed while changing the vertical extinction profile in a radiative-transfer calculation. The computed forcing changed substantially. The lesson is that knowing the total is not enough: vertical placement changes the energy calculation. Read the study ↗
Research note: radiative effect versus effective radiative forcing
A campaign calculation commonly compares fluxes with and without specified aerosols under the sampled conditions. Effective radiative forcing is a broader climate measure that includes rapid adjustments after a perturbation while excluding the response associated with surface-temperature change. A local clear-sky calculation should not be read as a global climate forcing estimate.
Close the energy account over the Indian Ocean
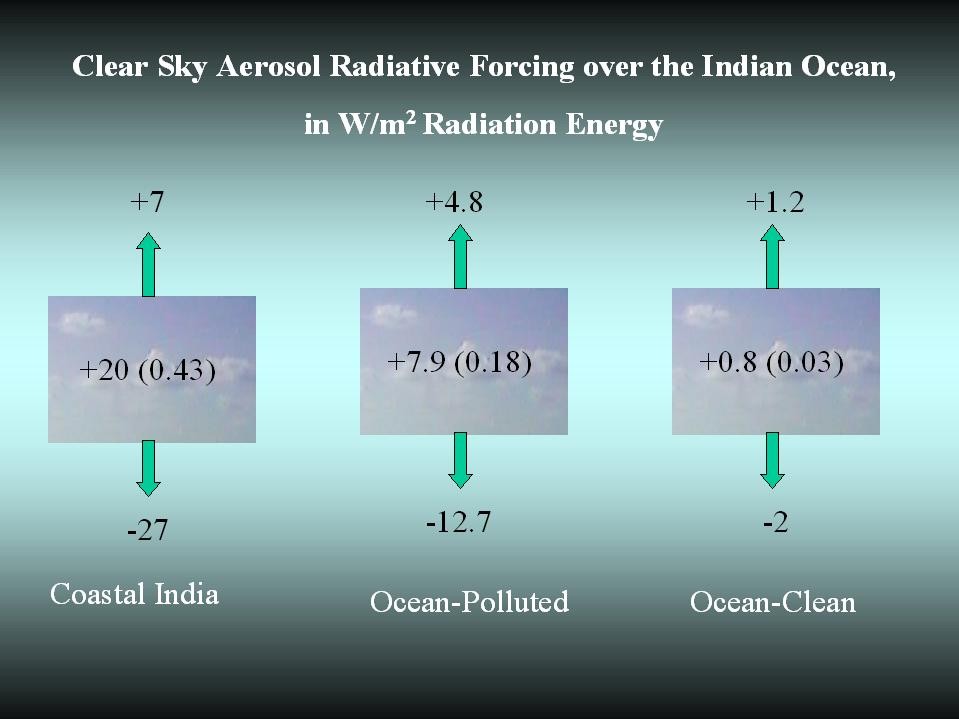
Ramanathan and colleagues’ integrated INDOEX analysis (2001), including A. Jayaraman, combined observations and models to examine surface dimming, atmospheric heating and regional climate effects. A reduction of sunlight at the surface and a change at the top of the atmosphere tell different parts of the energy story. The integrated INDOEX analysis ↗
Surface dimming, absorption and reflectionThis illustration from the personal archive shows clear-sky comparisons in W m⁻². Negative values below the columns show reduced surface energy, values inside describe atmospheric absorption, and the upper arrows show increased reflected sunlight.A. Jayaraman’s personal archive.View image ↗
In the archival diagram’s coastal-India example, the surface reduction of 27 W m⁻² is partitioned between 20 W m⁻² retained in the atmosphere and 7 W m⁻² additionally reflected upward. The upper arrow uses the outgoing-reflection convention; an energy comparison must keep that direction explicit.
Haze reduces contrast because light is scattered into the viewing path and object light is attenuated. Humidity can amplify that change by swelling particles. Visibility therefore responds to optical conditions, rather than simply tracking a dry particle-mass reading.
Different instruments reveal different parts of the problem. A photometer constrains column extinction; a nephelometer measures scattering by sampled air; an absorption instrument probes energy taken from the beam. Lidar adds vertical structure. Combining them makes the energy account more informative.
A photograph can show the appearance of haze. It cannot by itself determine single-scattering albedo, aerosol composition or radiative forcing. Those are measurement and inference questions.