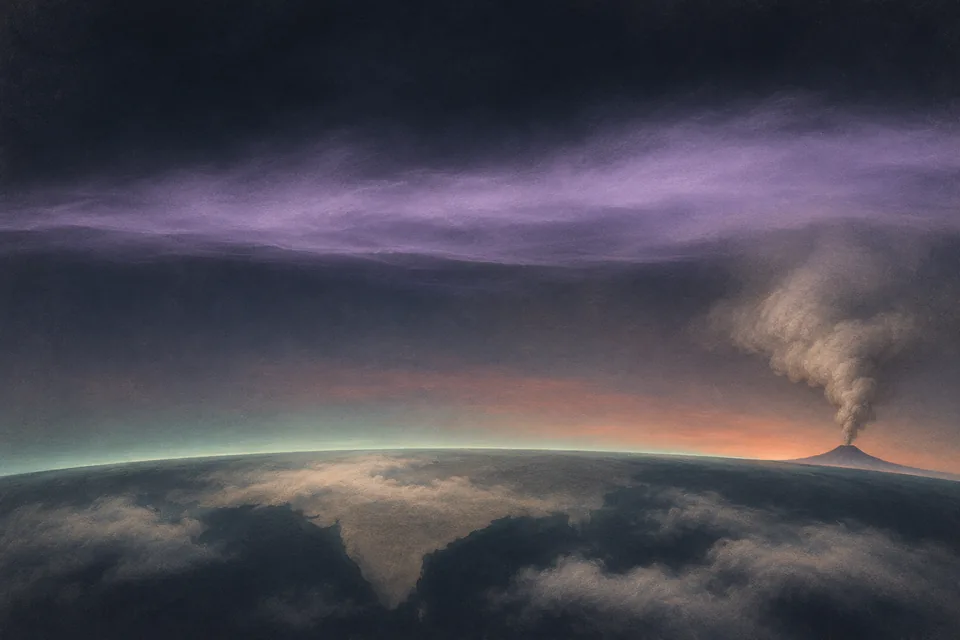
Conceptual illustration · An elevated volcanic aerosol layer

ATMOSPHERIC SCIENCE HYDERABAD / AHMEDABAD / 1991–1994

A volcano
above India.

In 1991, an eruption in the Philippines changed the stratosphere. Over India, balloons and lasers revealed what persisted above the weather.

THE QUESTION

What did Pinatubo leave in the sky over India?

The eruption ended. The layer persisted.

On 15 June 1991, Mount Pinatubo erupted in the Philippines. Months later, the atmosphere above Hyderabad still held an optical signature of the event.

The persistent layer was not simply fresh volcanic ash drifting unchanged across Asia. Sulphur dioxide injected high into the atmosphere underwent chemical conversion, forming sulphuric-acid droplets. Their size, composition and altitude gave them a different optical behaviour and lifetime from coarse ash near an eruption.

The stratosphere lies above most rain-bearing weather. Material reaching it is not washed out in the same way as aerosol in the lower troposphere. Transport, growth, dilution and settling shape its evolution over months and longer. A far-reaching climate perturbation therefore became a set of local measurement questions: where was the layer, how strongly did it extinguish light, and how did it change?

At the Physical Research Laboratory, investigators had already developed balloon photometry for upper-air studies. The Pinatubo work extended that observational lineage to an exceptional atmospheric event.
Two flights through a changing atmosphere

Sun-tracking and Sun-scanning photometers flew from Hyderabad on 26 October 1991 and 20 April 1992. The first experiment came roughly four months after the eruption, the second roughly ten months after it. The balloons carried optical instruments to about 34 km.

The payload did two related jobs. Continuous tracking measured direct solar intensity at selected wavelengths. Scanning measured the angular distribution of scattered sunlight. Meteorological information helped specify air density and distinguish molecular scattering from aerosol extinction.

Ramachandran, Jayaraman, Acharya and Subbaraya reported a distinct aerosol layer between 16 and 30 km in the October profile. Those are bounds from the sampled Hyderabad profile, not a globally uniform altitude range. The second flight supplied another vertical view months later. Read the study ↗

Methods: different channels, different purposes

The instruments included ultraviolet, visible and near-infrared bands. Channels sensitive to ozone and water vapour served different tasks from the aerosol channels. The analysis corrected for molecular scattering and gas absorption. Direct-signal changes and angular scattering were then used to derive extinction and particle-size information. Low-altitude cloud contamination and long solar paths limited parts of the usable profile.

Read the layer in height

Move the cursor through the 16–30 km band. Below, within and above it are different parts of the sampled atmosphere. A column optical depth alone would erase that vertical information.

The graphic marks the reported October bounds. It is a height schematic; the band does not mean extinction was uniform, nor that aerosol was absent outside it.

22 km
HYDERABAD / OCTOBER 1991

From light to particle properties

Extinction describes how much light leaves the original beam through scattering and absorption. In these flights, extinction was inferred from radiation measurements after accounting for other atmospheric effects. Particle size required another inference: comparing the observed angular scattering with calculations for assumed particle distributions and optical properties.

The authors found that particle-size information varied with altitude, so the layer was not described adequately by one size everywhere. They interpreted changes between the flights in terms of growth by coagulation and changes in particle number. That explanation linked several retrieved properties rather than treating a larger optical signal as a simple particle count.

A related 1994 paper estimated mode radius and asymmetry factor for the October layer. A mode radius belongs to a fitted size distribution, and an asymmetry factor describes directional scattering. Neither is a direct measurement of every particle. Read the study ↗

This is the distinction that makes optical aerosol research powerful and demanding: sunlight contains information about particles, but extracting it requires a physical model. Assumptions about refractive index and size distribution influence the answer.

Returning to a quieter stratosphere

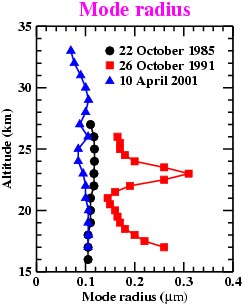
A later balloon flight on 10 April 2001 made it possible to compare the optical retrieval with the volcanic conditions of 1991 and an earlier 1985 profile. The mode-radius comparison places the larger particles of the volcanic case within that longer observational sequence.

Retrieved aerosol mode radius versus altitude for Hyderabad balloon flights in 1985, 1991 and 2001
A particle-size parameter with a historyMode radius in µm is plotted against altitude for the Hyderabad flights of 22 October 1985, 26 October 1991 and 10 April 2001. The values are parameters retrieved for an assumed size distribution.Ramachandran & Jayaraman (2003).View image

The fitted radius describes a distribution, not the size of every particle. The 2003 analysis used a lognormal distribution with a specified width, so the comparison also carries that modelling choice. Read the study ↗

A laser follows what a balloon cannot

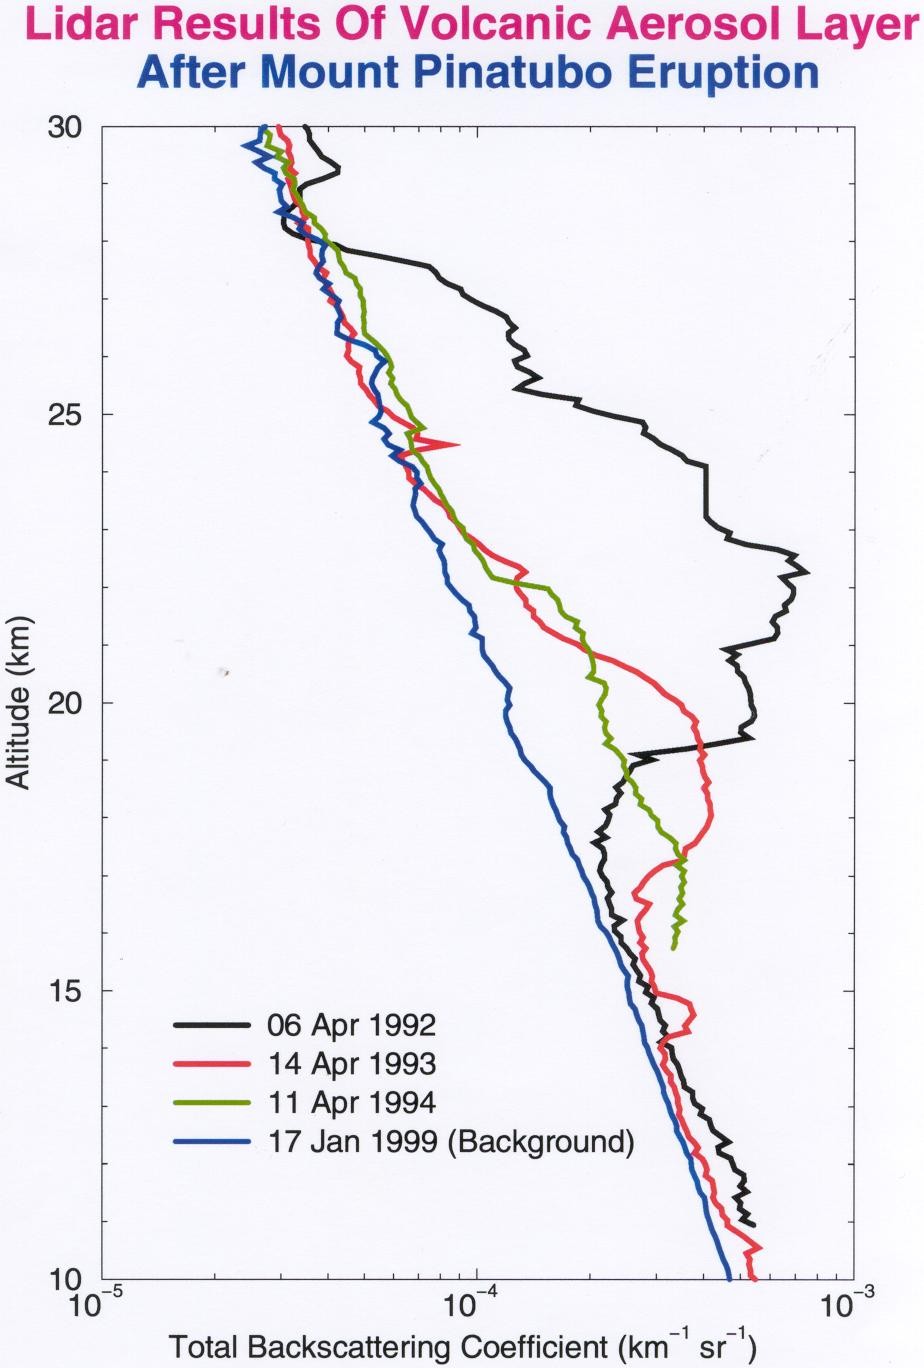
A balloon gives a detailed profile on a particular flight. Repeated ground-based lidar observations can track a layer through time. At Ahmedabad, a 532 nm backscatter lidar monitored the Pinatubo aerosol from April 1992 to May 1994.

Jayaraman and colleagues analysed the decline using several measures of the layer. A peak scattering ratio describes the strongest part of a profile; an integrated quantity describes loading through a vertical interval. If a layer spreads or changes shape, those measures need not decline at the same rate. Read the study ↗

Converting backscatter into aerosol mass introduced assumptions about particle size. The study examined sensitivity to assumed mode radius, showing why mass inferred from light cannot be treated as a direct weighing of the stratosphere.

A fitted decay timescale summarises a chosen observable over an interval. It does not mean each particle has the same lifetime or that the future must follow the same rate. Transport, growth and removal can change the signal together.

Total backscatter profiles over Ahmedabad in 1992, 1993, 1994 and 1999
Following the volcanic layer towards background conditionsAhmedabad profiles from 6 April 1992, 14 April 1993 and 11 April 1994 are compared with 17 January 1999. The logarithmic horizontal axis shows total backscattering coefficient in km⁻¹ sr⁻¹; altitude is in kilometres.A. Jayaraman’s personal archive.View image

The changing enhancement above the lower stratosphere can be read directly in height. Total backscatter contains both molecular and particle contributions. Retrieving aerosol extinction or mass from it requires further analysis.

Independent views, carefully compared

The balloon paper compared its results with Ahmedabad lidar and SAGE II satellite observations. The methods viewed the atmosphere differently: a moving payload using sunlight, a ground laser measuring returning light, and a satellite observing along an atmospheric path.

Comparisons therefore need wavelength, time, location, geometry and averaging to be specified. Different instruments do not necessarily sample the same air parcel. Similar structure can strengthen an interpretation without making all retrieved quantities identical.

HYDERABAD / 1991 & 1992

Go through it.

Balloon photometry resolved vertical extinction and angular scattering.

Balloon study ↗
AHMEDABAD / 1992–1994

Look repeatedly.

Lidar followed the optical layer’s evolution from one ground site.

Lidar study ↗
SATELLITE COMPARISON

Change the vantage.

SAGE II supplied another view, considered in the balloon paper’s comparison.

Comparison and methods ↗
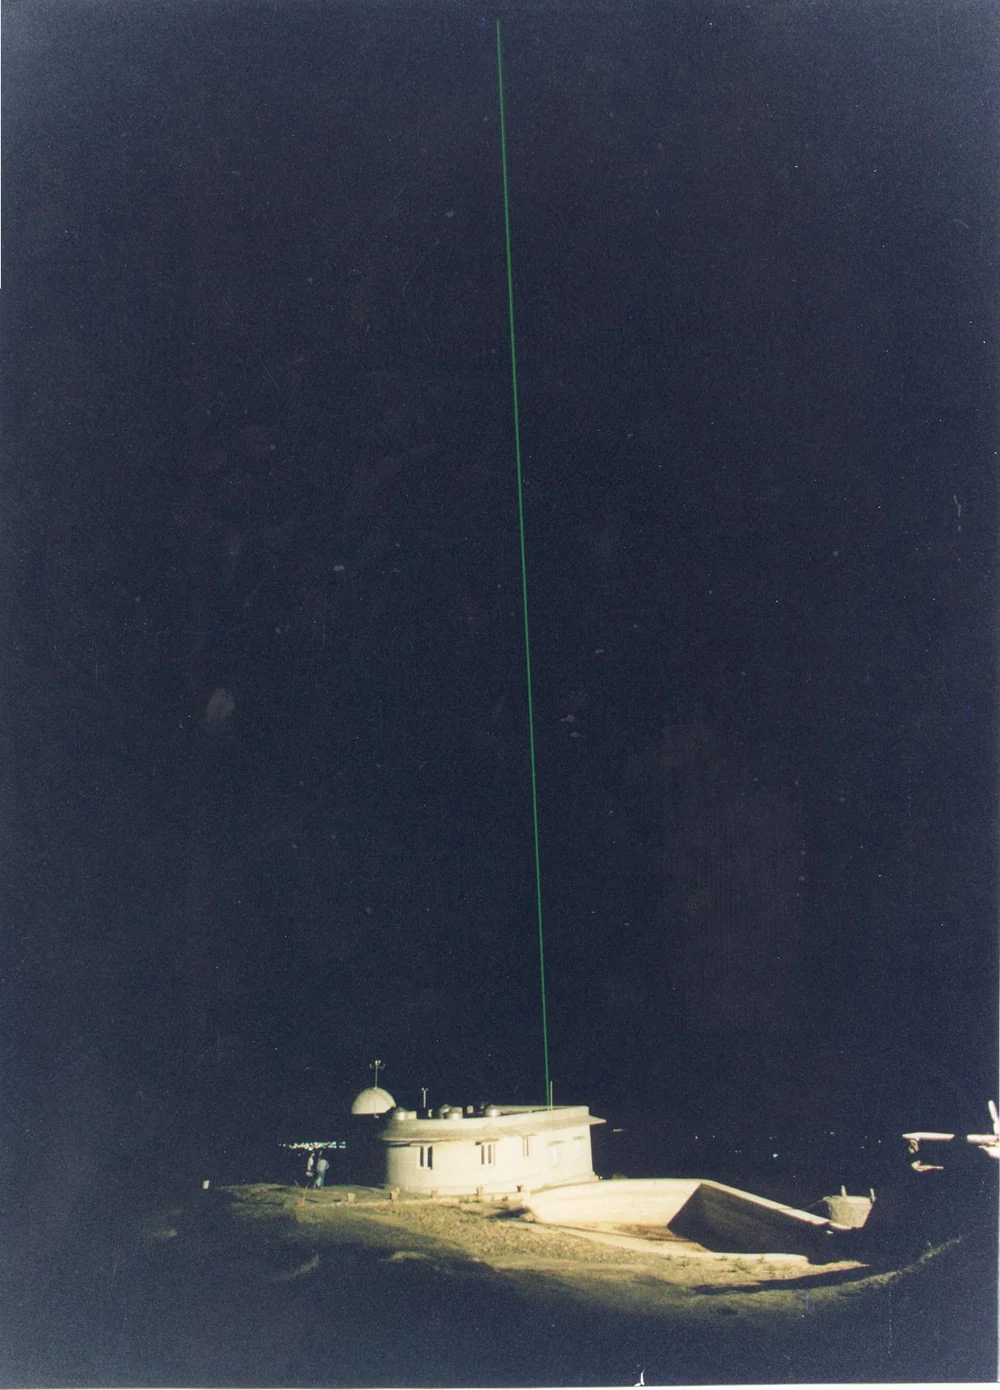
The PRL observatory at Mount Abu with an Nd:YAG lidar beam in the night sky
A second ground-based vantage pointAn Nd:YAG lidar operating at PRL’s Mount Abu observatory in Rajasthan. The comparison below uses Mount Abu profiles; the earlier time series in this chapter was measured at Ahmedabad.A. Jayaraman’s personal archive.View image
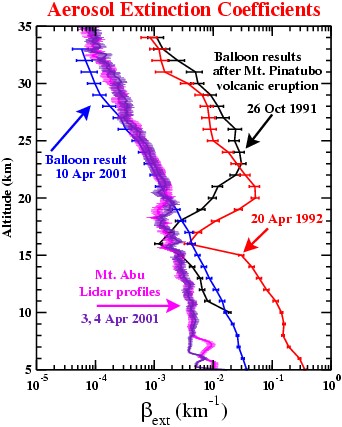
Balloon extinction profiles from Hyderabad and lidar profiles from Mount Abu
Compare the observable, the date and the wavelengthThe Hyderabad balloon profiles include October 1991, April 1992 and April 2001 at 500 nm. The Mount Abu lidar profiles were obtained on 3–4 April 2001 at 532 nm. The horizontal axis is aerosol extinction coefficient in km⁻¹.Ramachandran & Jayaraman (2003).View image

The comparison spans different locations, dates and wavelengths. The much weaker 2001 stratospheric extinction provides a useful contrast with the volcanic profiles, while the differences in sampling remain part of the interpretation.

A global event, measured locally

The Indian studies established that the volcanic aftermath was measurable in the stratosphere above India and could be followed with complementary optical methods. They also demonstrated how scientific interpretation depends on the property retrieved: extinction, number, size, peak scattering and mass are related but distinct.

The balloon paper was led by S. Ramachandran with A. Jayaraman, Y. B. Acharya and B. H. Subbaraya. The later lidar paper was led by A. Jayaraman with the same collaborators. Together, the papers form a sequence of questions answered through instrument development, field observations and analysis.

One question survives the volcanic episode: if two columns have equal optical depth, can we tell where the particles are? The answer takes us back to vertical profiling—and to why a high volcanic layer and a shallow urban haze cannot be understood from the same column number alone.

CONNECTED READING

Put the particles at a different height ↗

Move an idealised layer and keep its optical depth unchanged.

PAPERS & FURTHER READING

Follow the
evidence.

  1. S. Ramachandran, A. Jayaraman, Y. B. Acharya & B. H. Subbaraya (1994). Balloon-borne photometric studies of the stratospheric aerosol layer after Mt. Pinatubo eruption. Journal of Geophysical Research 99(D8), 16771–16777 ↗
  2. S. Ramachandran, A. Jayaraman, Y. B. Acharya & B. H. Subbaraya (1994). Mode radius and asymmetry factor of Mt. Pinatubo volcanic aerosols from balloon-borne optical measurements over Hyderabad during October 1991. Geophysical Research Letters 21(18), 2011–2014 ↗
  3. A. Jayaraman, S. Ramachandran, Y. B. Acharya & B. H. Subbaraya (1995). Pinatubo volcanic aerosol layer decay observed at Ahmedabad (23°N), India, using neodymium:yttrium/aluminium/garnet backscatter lidar. Journal of Geophysical Research 100(D11), 23209–23214 ↗
  4. S. Ramachandran & A. Jayaraman (2003). Balloon-borne study of the upper tropospheric and stratospheric aerosols over a tropical station in India. Tellus B 55(3), 820–836 ↗
  5. A. Jayaraman · Personal archive. Atmospheric research photographs, instrument diagrams and observations. Personal archive ↗

Image

100%Open image ↗