Conceptual illustration

ATMOSPHERIC SCIENCE DROPLETS / ICE / CLIMATE

Aerosols, clouds
& climate.

Cloud droplets begin on particles. From that small beginning, microphysics meets atmospheric motion, sunlight and the water cycle.

THE QUESTION

How can tiny particles influence a cloud?

The seed inside the droplet

Water vapour does not simply become a cloud wherever there is dust. A cloud forms when air motion, cooling, moisture and suitable particles meet.

As moist air rises and cools, it can become supersaturated: its water-vapour content exceeds equilibrium with a flat surface of liquid water at that temperature. Some aerosol particles then activate into growing cloud droplets. We call particles capable of doing so cloud condensation nuclei, or CCN, at a stated supersaturation.

Particle size and soluble material influence activation. Dissolved substances lower water activity, favouring water uptake; the curvature of a small droplet raises its equilibrium vapour pressure, opposing growth. Köhler theory brings these effects together. A given particle activates only when the environmental supersaturation exceeds its critical value. Explore CCN physics ↗
Cloud activation: a soluble aerosol grows in humid air and can activate as a dropletAEROSOLWATER UPTAKEACTIVATED DROPLETDry or partly hydratedHumid airSufficient supersaturation
Liquid-cloud activation, schematic and not to scale. Activation depends on particle size, composition and the maximum supersaturation reached in rising air.

The same water, shared differently

Suppose a liquid cloud contains a fixed amount of water. Dividing it among more droplets makes the average droplet smaller. If identical spherical droplets increase in number by a factor of eight, their radius halves at constant liquid water content.

The interactive below is this mass balance made visible. It lets you vary liquid water content as well as number. It does not assume every aerosol becomes a droplet: activation requires a separate calculation involving particle properties and the updraught.

For a fixed liquid water path and suitable optical conditions, a cloud with more, smaller droplets generally has greater optical thickness and can reflect more sunlight. This is the physical basis of the cloud-brightening effect associated with Twomey’s work. It is a constrained comparison, before the cloud changes dynamically. Twomey’s 1977 paper ↗

EXPERIMENT / FIXED LIQUID WATER

Share the water.
Change the droplets.

Increase droplet number while keeping liquid water content fixed. What happens to the radius of each identical droplet?

Physics and assumptions

r = [3L / (4πρwN)]1/3, using L in kg m⁻³, N in m⁻³ and water density ρw = 1,000 kg m⁻³. All droplets have the same radius; real clouds have size distributions.

This is a mass balance, not an aerosol activation, rainfall or climate model. The displayed circles are representative droplets, not a sampled cubic centimetre.

Why more particles does not mean a rainfall forecast

Warm rain develops when some droplets become large enough to collect others efficiently. A change in the initial droplet population can alter collision and coalescence. But a real cloud also entrains surrounding air, evaporates, rises, mixes and sometimes produces ice.

Those responses can change cloud water, lifetime and extent. Updraught speed affects the supersaturation reached and therefore how many particles activate. Clouds can also modify the aerosol population through chemistry and removal. Cause and response run in both directions.

That is why “more aerosol means less rain” is an unreliable rule for a particular storm or region. A defensible attribution must distinguish aerosol changes from meteorology and follow the relevant cloud regime. A droplet-size experiment is a way to understand one mechanism, not a monsoon prediction.

High clouds introduce ice

Cirrus clouds contain ice crystals, often near the cold upper troposphere. Their formation involves ice supersaturation and temperature-dependent nucleation pathways. Some aerosol particles can promote ice formation heterogeneously; sufficiently cold solution droplets can freeze homogeneously.

Ice crystals are not spherical water droplets. Their shapes influence scattering and polarisation, making depolarisation measurements useful to lidar studies. High, thin clouds can be difficult to see from the ground while still affecting radiation.

Cirrus both reflect solar radiation and interact with outgoing terrestrial infrared radiation. The balance depends on height, optical thickness, particle properties and the underlying scene. The familiar liquid-cloud picture therefore cannot simply be transferred unchanged to all high clouds.

Follow cirrus through the night

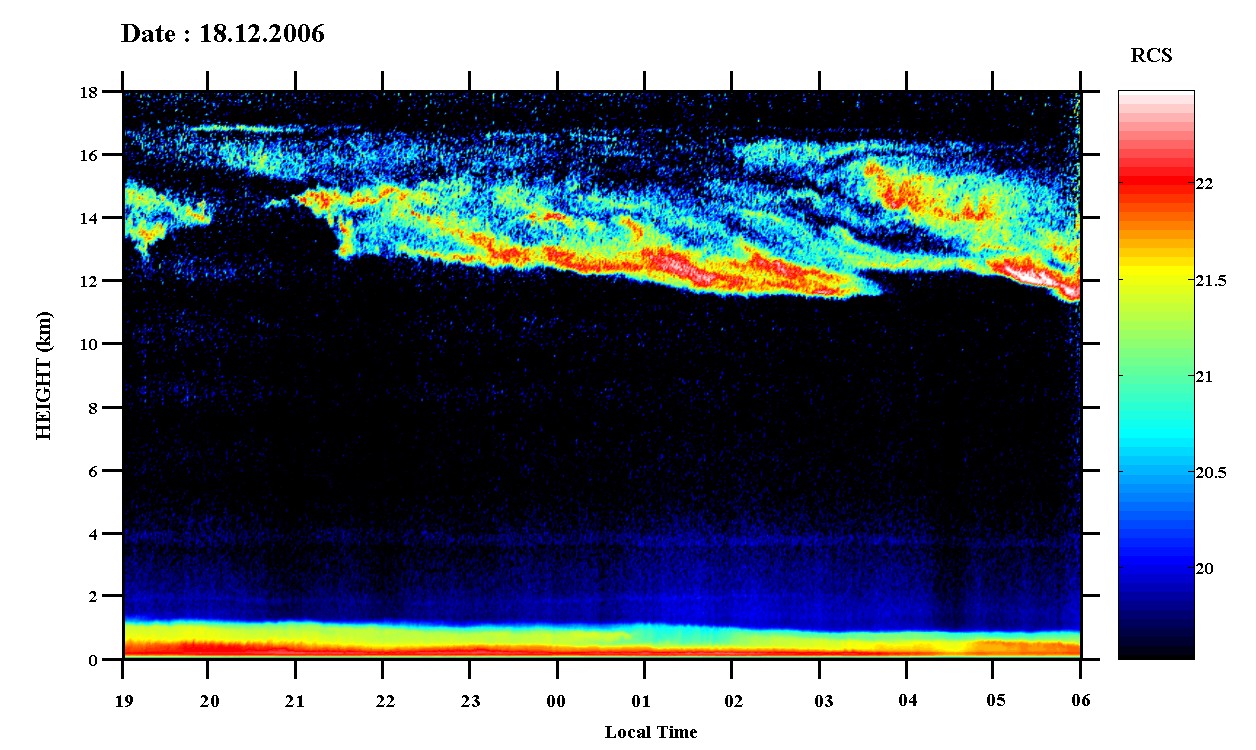
An individual observing night supplies the physical picture behind a long-term cloud statistic. At Gadanki, the lidar record below follows a high cloud system from evening to the following morning.

Gadanki lidar time-height record showing cirrus through the night of 18 December 2006
A night above GadankiThe record begins on 18 December 2006 and runs from 19:00 to 06:00 local time. Cirrus appears in the upper part of the column, roughly 12–17 km high, while the bright near-surface return belongs to the lower atmosphere. Colour represents range-corrected lidar signal.A. Jayaraman’s personal archive.View image

Read each vertical slice as the atmosphere observed above the station at that time. The changing cloud boundary includes air moving through the beam; it is not a track following one ice crystal.

Sixteen years looking above Gadanki

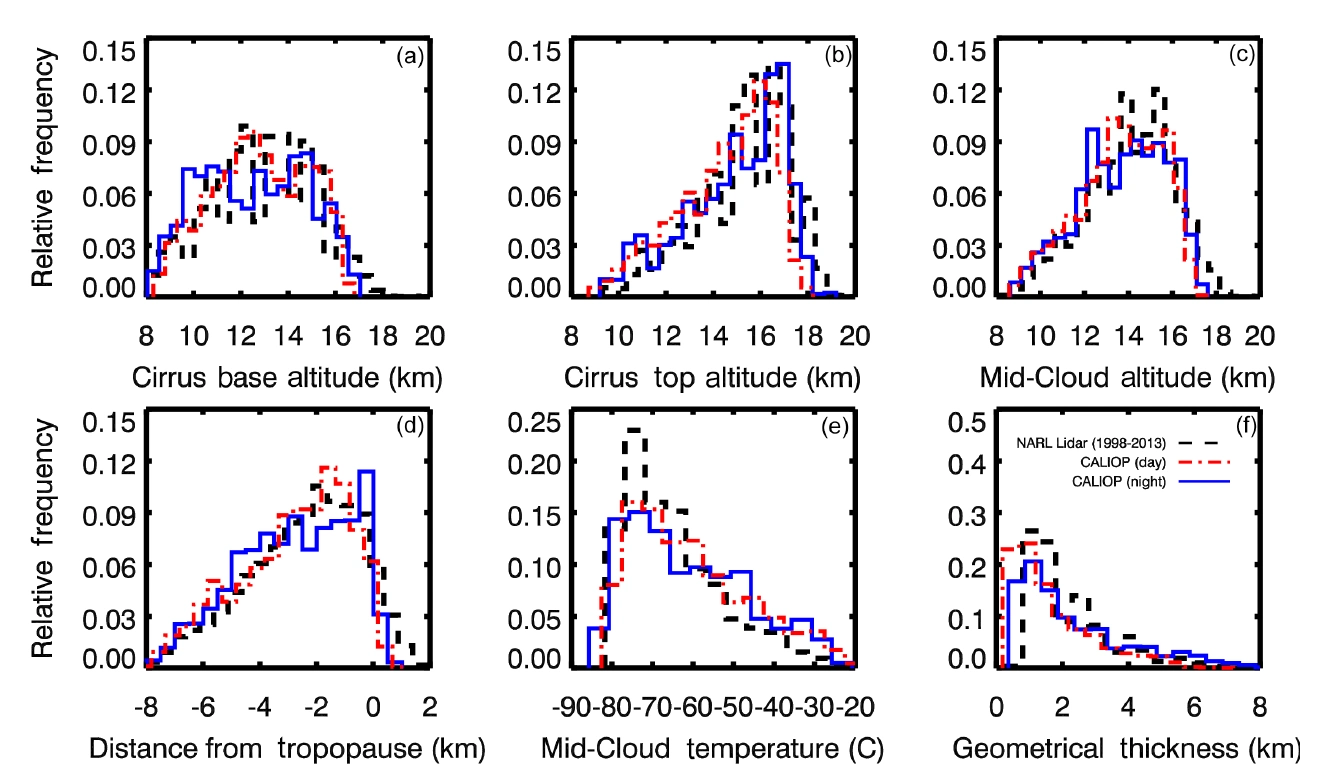
At Gadanki in southern India, Pandit and colleagues used a ground-based lidar record from 1998–2013 to study cirrus height, geometrical thickness and optical properties. They compared it with CALIOP observations from June 2006 to December 2013: one instrument looking upward from the ground, another downward from orbit. Read the study ↗

Such a comparison asks more than whether two curves resemble each other. Low cloud can obscure a ground lidar’s view of high cirrus. Rain and observing schedules affect which nights enter the record. An orbiting lidar samples at different times and along narrow tracks.

Cloud occurrence in the available profiles is therefore an occurrence relative to the observations made. It should not automatically be called the all-weather fraction of the sky covered by cirrus. The sampling denominator is part of the scientific result.

Histograms comparing cirrus altitude, temperature and thickness from Gadanki lidar and CALIOP
Pandit et al. (2015). Relative-frequency distributions from NARL lidar (1998–2013), CALIOP daytime and CALIOP night-time. The shared altitude structures and differences in distributions must be interpreted with each instrument’s sampling. Original paper · CC BY 3.0. Open full resolution ↗

The panels compare distributions rather than a continuous track through one cloud. Base, top and mid-cloud altitude describe different boundaries; geometrical thickness is the distance from base to top. Relative frequency is normalised to the corresponding sampled population.

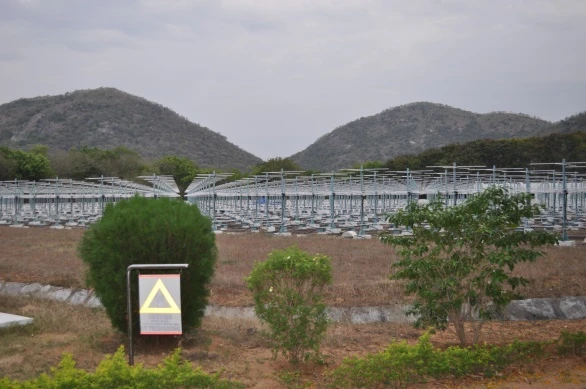
MST radar array at Gadanki
The MST radar facility at Gadanki. A. Jayaraman’s personal archive. Radar probes atmospheric motion; the cirrus record described here comes from a separate optical lidar.

A climate question with several moving parts

The IPCC’s Sixth Assessment attributes a net cooling influence to human-caused aerosol changes over the industrial era, including interactions with radiation and clouds. Uncertainty in the size of that influence reflects both aerosol properties and cloud responses. This global assessment does not specify the effect of one particle type everywhere.

In the upper monsoon atmosphere, the questions change again. A 2024 analysis of a Hyderabad balloon observation on 23 August 2017 examined how waves and hydration associated with Typhoon Hato helped explain a tropopause cirrus case. It combined several kinds of evidence rather than assigning cloud formation to aerosols alone. Read the study ↗

To connect a cloud to climate, first identify what changed, what was held fixed and which responses were allowed. That discipline connects a simple droplet experiment with a complex atmospheric model.

CONNECTED READING

The monsoon reaches upward ↗

Explore the Asian Tropopause Aerosol Layer and the measurements that test it.

PAPERS & FURTHER READING

Follow the
evidence.

  1. S. Twomey (1977). The Influence of Pollution on the Shortwave Albedo of Clouds. Journal of the Atmospheric Sciences 34, 1149–1152 ↗
  2. M. D. Petters & S. M. Kreidenweis (2007). A single parameter representation of hygroscopic growth and cloud condensation nucleus activity. Atmospheric Chemistry and Physics 7, 1961–1971 ↗
  3. A. K. Pandit, H. S. Gadhavi, M. Venkat Ratnam, K. Raghunath, S. V. B. Rao & A. Jayaraman (2015). Long-term trend analysis and climatology of tropical cirrus clouds using 16 years of lidar data set over Southern India. Atmospheric Chemistry and Physics 15, 13833–13848 ↗
  4. IPCC Working Group I, Chapter 7 (2021). The Earth’s Energy Budget, Climate Feedbacks, and Climate Sensitivity. Climate Change 2021: The Physical Science Basis ↗
  5. A. K. Pandit et al. (2024). Investigating the role of typhoon-induced waves and stratospheric hydration in the formation of tropopause cirrus clouds observed during the 2017 Asian monsoon. Atmospheric Chemistry and Physics 24, 14209–14238 ↗

Image

100%Open image ↗