Conceptual illustration

ATMOSPHERIC SCIENCE WINDS / LAYERS / REMOVAL

Following particles
across Earth.

An aerosol measurement has an address and a history. Winds carry particles, but layers, clouds and removal determine where they arrive.

THE QUESTION

How do local emissions become a distant atmospheric signal?

The air is connected

A ship far from shore can sail beneath air that recently crossed a continent. A city can sit below particles released by a distant volcano.

Transport links sources to observations. Advection carries material with the mean wind; turbulence mixes it; convection can move it rapidly upward. Dilution reduces concentration, while chemical conversion and condensation can add particle material along the route. Removal by rain or deposition interrupts the journey.

The wind direction at the instrument is only one clue. Air may have travelled at different altitudes and passed through several meteorological regimes. Back trajectories estimate prior air-parcel positions using winds, but are model-dependent calculations. Their uncertainty grows with travel time and with unresolved atmospheric motion.

A trajectory passing near a source region suggests a pathway. It does not by itself quantify the source’s contribution. Composition, timing, multiple trajectories and emission information can strengthen the interpretation.
Atmospheric layers with different transport and removal mechanismsSTRATOSPHERELonger persistence after major eruptionsTropopause: height variesTROPOSPHEREMixing · clouds · precipitation · transportSurface: emission and deposition
Atmospheric structure, schematic. The boundary layer occupies the lowest, surface-influenced part of the troposphere and changes with weather and time of day.

Continental air over an ocean

During winter, circulation can carry continental air over the northern Indian Ocean. INDOEX used that setting to study aerosols and their radiative consequences. Ship measurements crossed boundaries between contrasting air masses and helped connect regional emissions with an oceanic atmosphere.

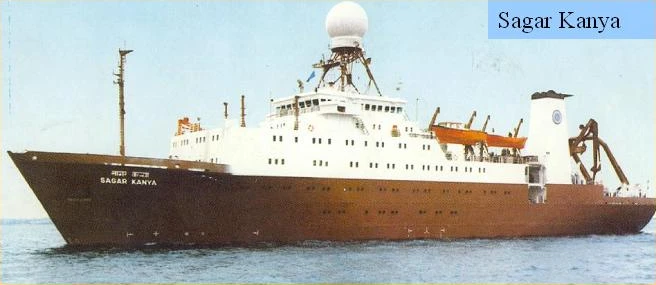
The 1999 Sagar Kanya investigation measured column optical depth alongside near-surface properties. A change in the column and a change at the ship need not have the same amplitude. The ship samples one height; sunlight passes through the atmosphere above it. An elevated transported layer can therefore matter even when the deck-level concentration is modest. Read the study ↗

The Inter Tropical Convergence Zone marked an important transition in the cruise, but it was a moving meteorological feature. A north–south contrast is not a permanent line drawn on the ocean. The sequence of weather and the ship’s sampling both belong in the interpretation.

Sagar Kanya research vessel
Sagar Kanya, the platform for Indian Ocean aerosol measurements. A. Jayaraman’s personal archive.
CONNECTED READING

An ocean that carried the continent ↗

Follow the full sequence from cruise design to scientific interpretation.

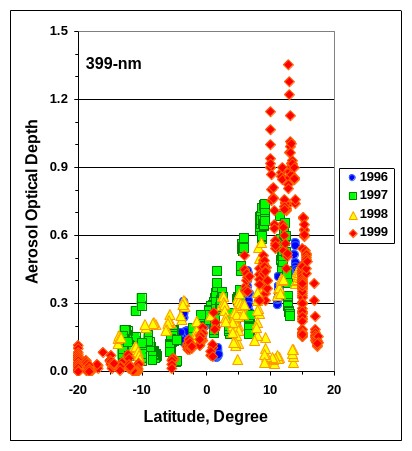
Aerosol optical depth at 399 nanometres against latitude for four INDOEX cruises
Continental influence across four cruisesOptical depth at 399 nm is plotted against latitude for the 1996, 1997, 1998 and 1999 Sagar Kanya cruises. The higher and more variable values north of the equator contrast with the low values farther south.A. Jayaraman’s personal archive.View image

The spread of points matters as much as the overall gradient. These are four moving campaigns, with changing air masses and weather. Their shared contrast does not imply that every cruise sampled an identical atmospheric boundary.

Height changes the meaning of a column

The boundary layer is the lowest part of the atmosphere strongly influenced by the surface over short timescales. Its depth changes with sunlight, stability, terrain and weather. Material concentrated in a shallow layer produces a different local environment from the same extinction spread through a deep layer.

Above it, the free troposphere can transport layers over long distances. A sun photometer integrates both. A surface instrument may sample neither an elevated plume nor the full range of material aloft.

Try moving the idealised layer while holding optical depth fixed. Then change thickness: the same integral can arise from strong extinction over a short distance or weak extinction over a longer distance. A column number cannot distinguish those possibilities on its own.

EXPERIMENT / AN IDEALISED COLUMN AT 550 nm

Same column.
Different air at the ground.

Move and spread a uniform layer. Its optical depth stays at 0.30 while its local extinction changes.

5 km0 km01.0Extinction at 550 nm (km⁻¹)

Physics and assumptions

τ = ∫β(z) dz = β × Δz = 0.30. The model layer has constant extinction β and zero extinction outside it. It has sharp edges for clarity. It is a teaching model, independent of the historical observations.

The integral alone cannot locate the particles or identify composition, dry mass or exposure. Molecular scattering and clouds are excluded.

A day seen in the laser return

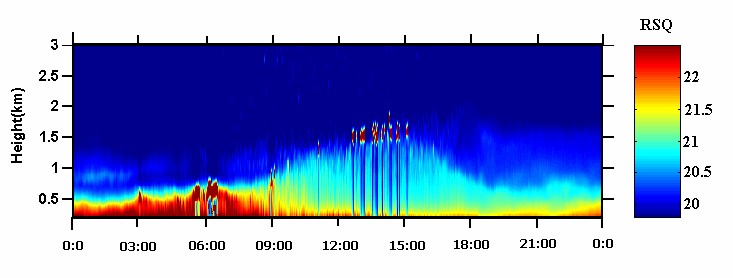
At Gadanki, a day-long lidar record shows how the strongly scattering lower layer changes its vertical extent. The deeper daytime structure makes the redistribution visible before we reduce it to an idealised column.

Range-corrected lidar signal over Gadanki through a full day
The lower atmosphere through a dayHeight is in kilometres and the horizontal axis follows local time. Colour gives the range-corrected optical return. The daytime structure extends higher than the shallow layer seen during much of the night.A. Jayaraman’s personal archive.View image

A return image locates optical structure. Retrieving extinction requires the calibration and assumptions described in the instrument chapter; the colours alone do not supply particle mass.

Above much of the weather

The tropopause separates the troposphere from the more stably stratified stratosphere. Its altitude varies with latitude and meteorological conditions. Aerosols that reach the stratosphere encounter a different removal environment from those within rain-bearing weather systems.

After Pinatubo, sulphur-containing gases formed a persistent sulphate aerosol layer. Indian balloon and lidar observations followed its vertical structure and evolution. The observations established an atmospheric effect far from the eruption without measuring the entire route taken by each particle. Read the study ↗

Growth, settling, transport and dilution all affect the evolution of a volcanic layer. A declining peak backscatter signal does not uniquely measure particle removal: the layer may spread, and the particle size distribution may change. Integrated and peak quantities therefore answer different questions. Read the study ↗

The monsoon reaches upward

The Asian summer monsoon circulation reaches well beyond surface rain. Convection and large-scale circulation help shape the upper troposphere and the region near the tropopause, including the Asian Tropopause Aerosol Layer. Its composition, formation and vertical distribution require targeted observations.

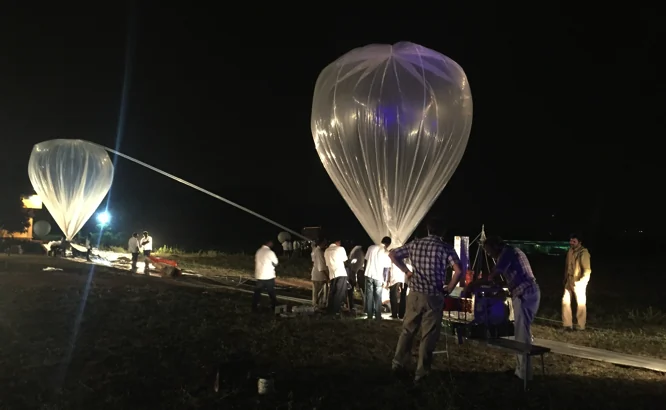
The BATAL campaigns brought balloon instruments to Gadanki and Hyderabad. In 2017, payloads combined backscatter measurements, particle counting and material collection for chemical analysis. NASA Langley, NARL, TIFR, PRL and other collaborators contributed complementary capabilities. Read the study ↗

Teams preparing stratospheric balloons for launch at the TIFR Balloon Launch Facility, Hyderabad
Preparing to enter the upper atmosphereStratospheric balloons being prepared for launch at the TIFR Balloon Launch Facility, Hyderabad. Each payload joins an instrument to the practical work of launching and tracking it.A. Jayaraman’s personal archive.View image

These instruments do not all measure the same population in the same way. An optical return depends on wavelength and particle scattering, a counter has size thresholds, and collected material must be interpreted through its sampling conditions. Agreement requires attention to those distinctions.

A later study of the 23 August 2017 Hyderabad case examined tropopause cirrus in relation to Typhoon Hato, waves and hydration. It illustrates how a local balloon profile can be interpreted within a much wider dynamical setting. Read the study ↗

A map is a question, not the answer

To follow transported aerosol convincingly, join time, height and properties. Ask whether the plume was present at the measured altitude, whether the proposed source was active, and whether the particles had time to transform or be removed. A colour on a satellite image is the start of an investigation.

Optical imagery cannot uniquely separate every source. Some transported layers are hidden by clouds; some near-ground measurements are unrepresentative of the column. Lidar, sun photometry, composition and meteorology provide different constraints.

The strongest transport stories combine those constraints while preserving their uncertainties. They explain why a distant event is plausible, which observations support it, and which inferences remain dependent on models.

CONNECTED READING

Different windows on the same air ↗

Learn how each observing method constrains a different part of the journey.

PAPERS & FURTHER READING

Follow the
evidence.

  1. S. Ramachandran, A. Jayaraman, Y. B. Acharya & B. H. Subbaraya (1994). Balloon-borne photometric studies of the stratospheric aerosol layer after Mt. Pinatubo eruption. Journal of Geophysical Research 99(D8), 16771–16777 ↗
  2. A. Jayaraman, S. Ramachandran, Y. B. Acharya & B. H. Subbaraya (1995). Pinatubo volcanic aerosol layer decay observed at Ahmedabad (23°N), India, using neodymium:yttrium/aluminium/garnet backscatter lidar. Journal of Geophysical Research 100(D11), 23209–23214 ↗
  3. A. Jayaraman, D. Lubin, S. Ramachandran, V. Ramanathan, E. Woodbridge, W. D. Collins & K. S. Zalpuri (1998). Direct observations of aerosol radiative forcing over the tropical Indian Ocean during the January–February 1996 pre-INDOEX cruise. Journal of Geophysical Research 103, 13827–13836 ↗
  4. A. Jayaraman, S. K. Satheesh, A. P. Mitra & V. Ramanathan (2001). Latitude gradient in aerosol properties across the Inter Tropical Convergence Zone: Results from the joint Indo-US study onboard Sagar Kanya. Current Science 80, supplement, 128–137 ↗
  5. H. Gadhavi & A. Jayaraman (2006). Airborne lidar study of the vertical distribution of aerosols over Hyderabad, an urban site in central India, and its implication for radiative forcing calculations. Annales Geophysicae 24, 2461–2470 ↗
  6. NASA Langley Research Center and Indian collaborating institutions (2017). BATAL 2017 mission report. Balloon measurements of the Asian Tropopause Aerosol Layer ↗
  7. A. K. Pandit et al. (2024). Investigating the role of typhoon-induced waves and stratospheric hydration in the formation of tropopause cirrus clouds observed during the 2017 Asian monsoon. Atmospheric Chemistry and Physics 24, 14209–14238 ↗

Image

100%Open image ↗